


How to Do Descriptive Statistics on SPSS
In today's world, data science is the most common and innovative technology. Every data science project starts with describing, visualizing, and summarising the data. Those who examine the characteristics and attributes of the data by descriptive statistics always make the best model. Descriptive statistics offer insight and numerical summaries of data, allowing us to handle and interpret data more efficiently.SPSS is a very popular software that most statisticians use to analyze a large data set and run multiple tests. Therefore, beginners usually search for "how to do descriptive statistics on SPSS." And, this blog will describe the steps to do descriptive statistics on SPSS. Apart from this, you can also appoint our experts for SPSS assignment help at an affordable cost.
What is Descriptive Statistics?
Descriptive statistics are descriptive coefficients used to summarize a given data set. It can be a representation of the entire data or a sample of the population. In short, descriptive statistics describe a particular data's characteristics by providing a summary of the data.
Center measures are the most recognized type of descriptive statistics. These mean, median, and method are mostly used in each level of mathematics and statistics.
Descriptive statistics are mainly used for two purposes.
- First, to provide basic information of variables in the dataset.
- Secondly, to highlight possible relationships between variables.
Descriptive statistics should be used to condense difficult-to-understand insights of huge data sets into small-sized descriptions. For example, a student's GPA (grade point average) is a small number representing a student's overall performance.
What is SPSS Software?
SPSS is a software package that is extremely helpful in studying complex statistical data. SPSS was founded in 1968 by SPSS Inc., which IBM later purchased in 2009.
Due to its English-like commands and simple user manuals, it is widely used by marketing organizations, government, education researchers, data miners, and many others to process and analyze data. Most successful research agencies use SPSS to mine textual data and analyze survey data for the best results. Therefore, it is better to perform descriptive statistics on SPSS.
Steps to Perform Descriptive statistics on SPSS
Different steps to calculate descriptive statistics on SPSS are given below-
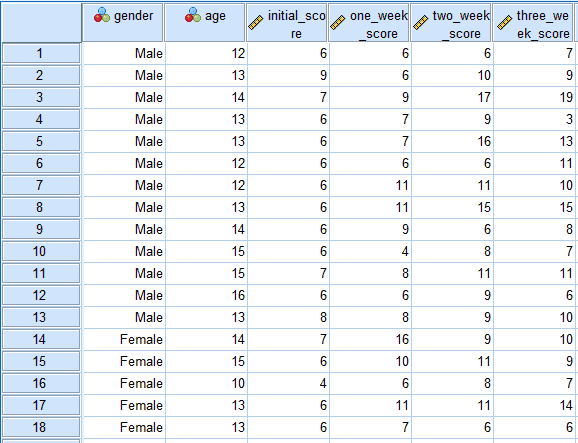
Input Data in SPSS
SPSS allows manual data entry as well as data import from various sources. The steps to import data from Excel are as follows -
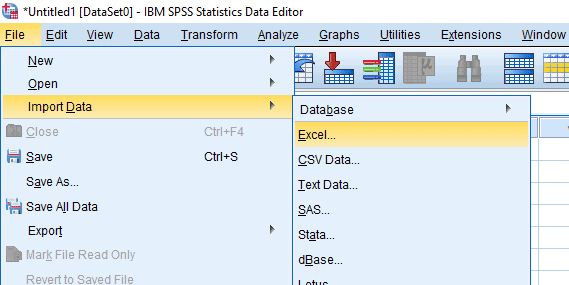
- First, choose 'File' from the menu.
- Second, select Import Data> Excel.
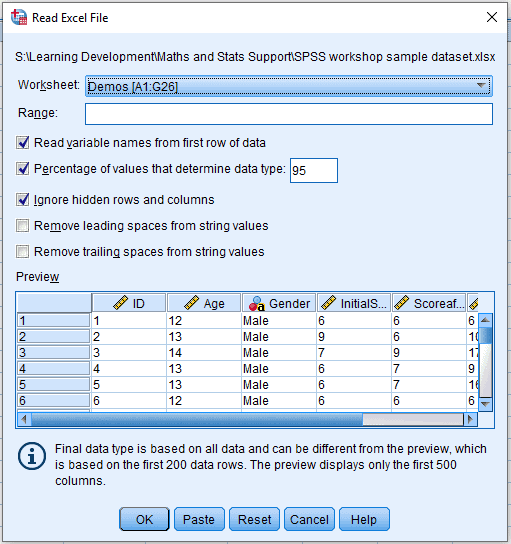
- Third, look at the data in the file manager and click 'Open.'
- Finally, select the range of cells and click 'OK.'
After importing the data into SPSS, click on 'Variable View,' and this sheet will open.
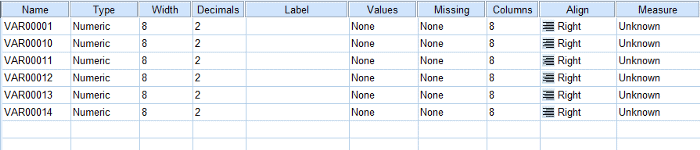
SPSS allows anyone to make changes here as per their convenience to set the variables correctly. After making the important changes, click on the ' Data View' option in the lower corner of the screen, and this screen will appear.
Descriptive Analysis SPSS
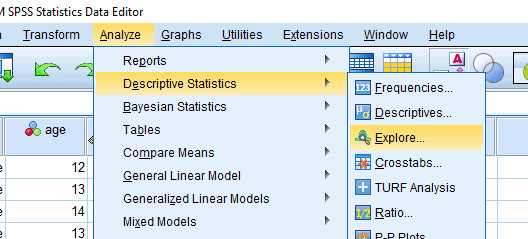
After inserting the data into the SPSS software, the next step is to execute descriptive statistics using SPSS. Various steps to calculate descriptive statistics are given below-
- First, go to 'Analysis' in the top menu and choose 'Descriptive Statistics'> 'Exploration.'
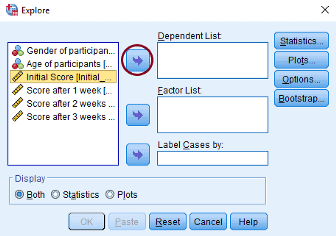
Now a pop-up window will appear. Click on the variable and choose the blue arrow to enter the dependent list box's target variable.
Third, click on 'Statistics,' tick 'Descriptives,' and press 'Continue.'
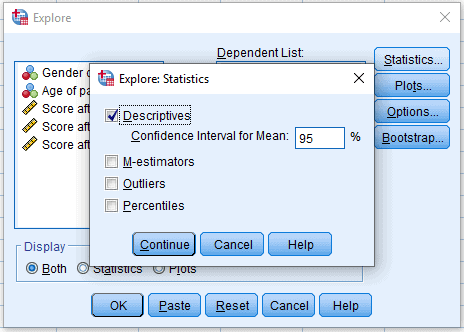
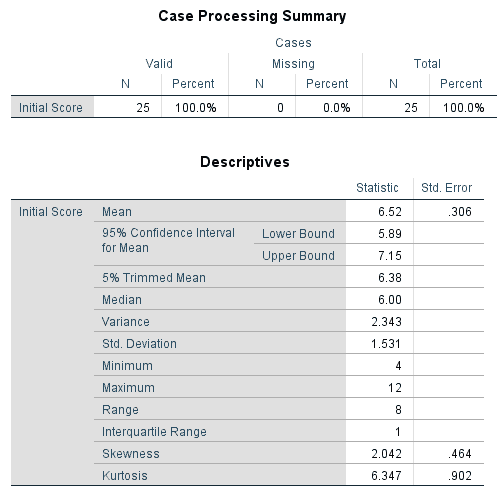
Finally, click 'OK,' and SPSS will present the final result.
Why is SPSS best for Descriptive Statistics?
There are multiple software options available that can generate descriptive statistics. Now, the question is why SPSS is a good choice for the performance of descriptive statistics.
Some of the reasons supporting this argument are as follows-
Simplicity
SPSS is easy to use for any community. Even beginners who do not know coding or statistics can use SPSS.
Complete Numerical Analysis
SPSS provides complete descriptive statistics analysis in numerical form.
One can easily generate a measure of dispersion, i.e., variance, standard error, range, standard variance, kurtosis, and skewness. Also, one can measure the central trend that includes the mean, median, and mode as the necessary and most popular analysis.
Also, quartet, minimum, maximum, and percentile are possible as a measure of condition.
Customization
SPSS provides complete control over descriptive statistics. Therefore, it is entirely the user's choice of what to display and whatnot. One can easily customize it with a few clicks.
Conclusion
This blog has given every piece of information about how to do descriptive statistics on SPSS. Information about why SPSS is a good choice for performing descriptive statistics is also mentioned. Descriptive statistics are also known as summary statistics because it summarizes large data sets. Besides, it helps data analysts to understand the data better. Besides, newbies generally want to know the process of calculating descriptive statistics on SPSS. To help them, we covered all the steps to generate descriptive statistics on SPSS. We also provide an SPSS Assignment help and statistics assignment help service to assist you in every SPSS difficulty.


Statistical concepts are tough to understand and interpret and at the same time, a high degree of accuracy requirements in the statistical analysis.
Are you doing the different computations to get the outcome, but still getting errors?If you need SPSS assignment help, not having sufficient time to complete your SPSS assignment, new to SPSS or find it difficult to achieve on your own.
Take help from experienced professionals who can assist you in every case.
You can send the specific requirement what is required by your professor so that the experts can work accordingly to help you.
Experts can assist you in challenging and lengthy assignments too.
They can also provide a solution to quiz and exams related to SPSS Assignment.


Students are being assigned statistics assignments just to boost their knowledge.
Different branches of statistics Descriptive statisticsIn descriptive statistics, patterns are interpreted and summarized in a logical manner.
In the absence of convenient or impossible means of examining individual members of the population, random samples are collected from populations to define them and make assumptions.
Understanding The Statistics TopicOrganize yourselfMake sure all your material is readyTimetable is important.
Don't be distractedStart your assignment slowlyBefore moving on to another problem, complete the previous oneNever give up Top Tips On How To Start Statistics Assignment Focus on the lectureRegular classes provide most of the assignment material.
Ask questions where neededMost students have trouble grasping everything they are taught in lectures.

Statistical software has become the lifeline of many compositions.
You can't do a lot of things without the help of statistical data.
Besides, if we don't handle the data carefully, we can get real facts about the data.The statistics play a critical role in the planning and execution phase.
If you analyze the data manually, you will find it difficult to get the desired result from the data.
But don't worry, here's the best statistical plan in the world that will help you get the results you want from the same data.
Besides, we use it for descriptive statistics, pregeometric and nongeometric analyses, etc.

The study of statistics closely deals with the collection, analyzation and interpretation of data which helps individuals to handle accurate results about different problems across the globe.
As a branch of Mathematics, Statistics provides clear data that guides people to derive unbound knowledge about the world around them which would have otherwise been difficult to observe.
Online statistics assignment help will enable you to find out about this subject in detail.
Statistics can be applied to several subjects together from Psychology, Social Science to even Biology for diverse experiments and informative use.
While Descriptive Statistics summarises a collection of data, Inferential Statistics helps us draw inferences about the population and more.
Anybody who studies Statistics is prone to higher chances of receiving opportunities for esteemed career choices in the industry today.


