


Experienced entrepreneurs know that building successful products is not about damn luck or revolutionary ideas; it’s more about data-driven decisions and careful analysis of the market. There are plenty of books and posts written on this topic, but it still takes days of research to create some sort of a mindmap and understand startup metrics and their common use cases.
Let’s assume that we are building a social network, and our business model is ad-based. The longer the average session duration in our app, the better, right? It means that our ads will get more impressions from our app users.
But what if we are building not a social network, but a search engine? Is it a positive change when the average session duration grows? Or it means that our UX is getting worse, and users have to spend more time looking for the requested information?
And lastly, what does the average session duration mean for a SaaS application like GitHub or Slack?
The problem here is that startups try to create something unique by definition and cannot use the same metrics as a measure of their success/progress.
Sometimes, a metric has opposite meanings for different business models.
Before We Get to Actual Metrics
In order to provide you with any recommendations, we need to find similarities in startup businesses and group them up somehow. I believe that the two main factors that define what metrics are more important for your business are:
Business Model
All the efforts of any business are always focused on the only goal: profits maximizing. A business model defines revenue sources and all the financial metrics that depend on it.
Current Stage
In the beginning, every startup faces an atmosphere of extreme uncertainty. As it progresses over time, it validates business hypotheses one by one and picks more and more precise metrics to rely on.
Note: In terms of this post, we don’t discuss the business models that assume uneven revenue distribution across customers. If your business provides a service to one or two big clients that generate 80% of your revenue, data analysis won’t be as helpful as for the business models above.
Absolute Values vs Growth over Time (MoM, QoQ, YoY)
It’s important to understand that you can track both absolute values of a metric, as well as its change compared to the previous period of time when it makes sense. When you need to see how a certain metric grows over time, you can use Month-over-Month (MoM), Quarter-over-Quarter (QoQ), or Year-over-Year (YoY) metrics.
The most common use of this type of metric is Revenue Growth, which is featured in the table below, but you can apply it to any other metric when it makes sense. To give you an example, let’s compare Total Revenue vs. Monthly Revenue vs. Month-over-Month Revenue Growth of a company below.
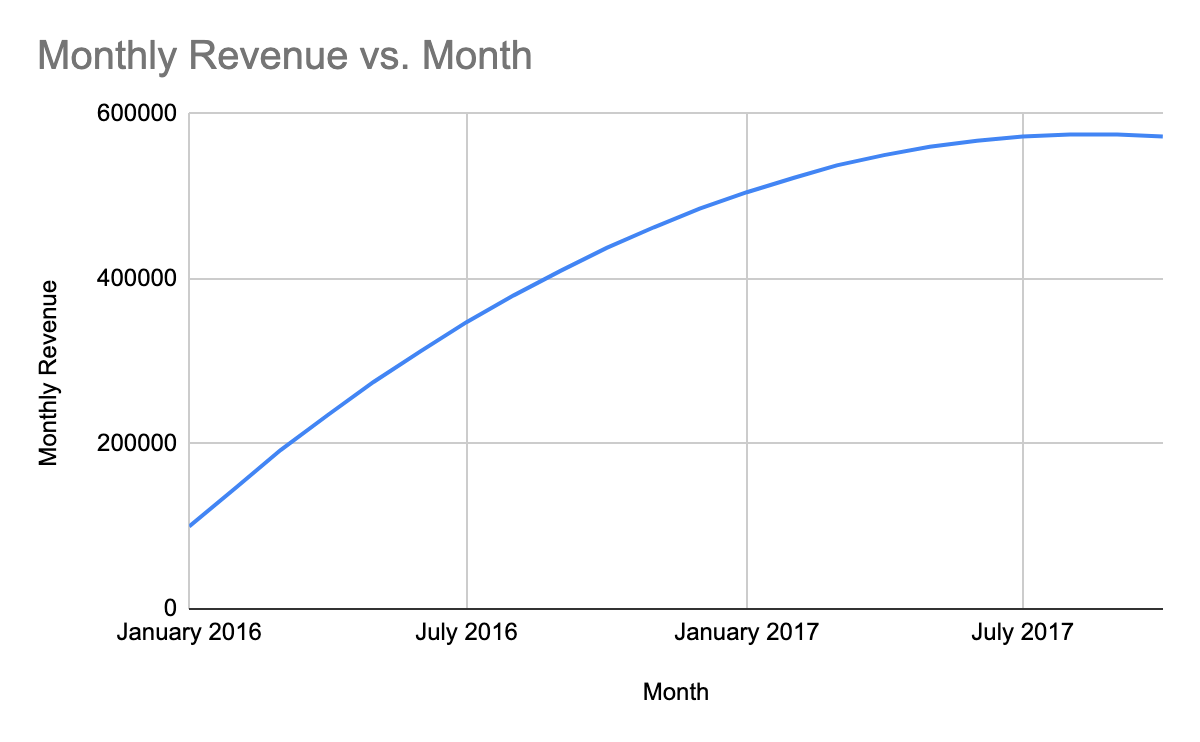
Here is the graph of its Total Revenue:

Looks good, right?
Seems like the company is growing. But wait a minute, this is Total Revenue Graph which adds up new revenue on top of what they already earned. To be honest, the Total Revenue graph doesn’t make a lot of sense and is used pretty often to impress prospect investors. Let’s review Monthly Revenue graph of the same company:
Seems like it’s not that good. What experienced entrepreneurs and investors pay more attention to is the Month-over-Month (MoM) Revenue Growth graph, and for this company, it looks like below:
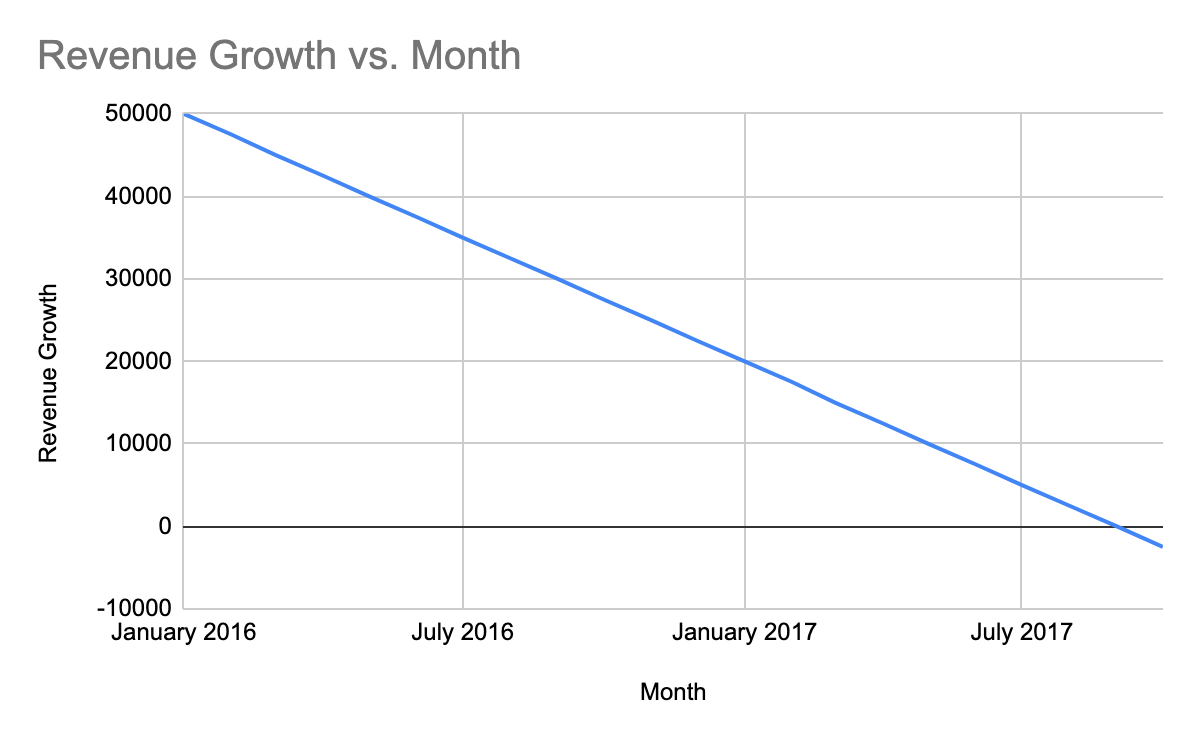
This MoM Revenue Growth graph clearly shows that the company stopped growing. Moreover, it started shrinking. This may indicate that it’s business model doesn’t scale well.
North Star Metric
Tracking a whole bunch of different metrics is difficult, especially when each one of them has its own priority, and your team is growing quickly. That’s why many businesses try to measure their success/growth using just one metric and call it North Star Metric (NSM). Here are some notes about using NSM based on our experience:
- Having NSM in place makes the decision making process much easier. Ex: If a new feature doesn’t drive NSM growth, it means that your team should stop working on that.
- It’s pretty difficult to define a single metric that would capture your business goal. That’s why you need to readdress your NSM once in a while, especially when shifting your business priorities.
- NSM can be a complex metric (ex., custom formula), and almost always, it’s different from business to business.
- Sometimes businesses pick a basic metric as their NSM so their team can understand it easily.
Here are some good NSM examples:
| Company | NSM |
|---|---|
| Daily Active Users | |
| Uber | Weekly Rides |
| Walmart | Average Number of Items Bought |
| Average Number of Messages Sent | |
| Quora | Number of Questions Answered |
If you’d like to learn more, have a look at an example of how Thoughtbot calculates its NSM.
Financial Metrics
This is the type of metric that indicates where your business stands currently. Usually, financial metrics are not actionable but show the overall success/potential of your business.
For an easier view, leaving the link to the financial metrics table.
Acquisition Metrics
These are the type of metrics that indicate how fast your business grows. With the help of these metrics, you can project your financial KPIs.
It’s important to note here that all the acquisition metrics are usually tracked against different acquisition channels (blended, organic, paid marketing, etc.) to determine the most effective ones.
For an easier view, leaving the link to the acquisition metrics table.
Engagement Metrics
If acquisition metrics show how fast you grow, then engagement metrics indicate the quality of your growth and value you bring to your customers. Sooner or later, every business starts to focus on this type of metrics, especially in a competitive market.
For an easier view, leaving the link to the engagement metrics table.
If you want to know, what metrics may be useful for your product/startup/business, read the full startup metrics guide on the datarockets blog.


Since Airbnb was founded in 2008, it has grown into one of the hottest private companies in the world, valued at over $30 billion. These days the platform lists millions of houses and rooms. For many young tourists it is has become an affordable and popular way to find accommodation when travelling.
Airbnb has had an amazing 10 year journey. There are many lessons that tech startup founders and travel app developers can learn from their success story.

Although many have tried, few have succeeded at creating a unique and profitable website.
However, Sophomore Yan Gorshtenin has been successful in founding the innovative website “Netlodge.” Netlodge, a database targeted for startup companies, entrepreneurs and investors, consists of over 25,000 videos of high quality entrepreneur and business guidebooks from startups and founders all around the world.
“Our team of professional curators bring their expertise and handicraft to select unique, high quality content of startups and business related news, so that you can spend less time searching and more time enriching your mind,” said Gorshtenin.
He developed the website completely from scratch, a task that required hours of hard work and many four am coffee runs.
“Basically, I always wanted to start a career in business.”
Gorshtenin began brainstorming and planning the future of Netlodge in October 2014 and launched the site in April 2014 with 3983 followers and subscribers.

Blog about startup entrepreneurship ideas and how it is going green. How to sell organic food and how to run this business sucessfully.

Eventually some people feel that Travelling relishes their souls and they love travelling just to explore.
Here the success is possible only when you understand the people requirement and providing solutions according to that would be a better choice.
Companies Who Took Over This Favourable Knocks
Uber : One of the pioneers in the on demand field for transportation is Uber, They actually gave different version among the user to look for a cab in a tap.
They all worked in the peer to peer concept.
So dig out how financially you are strong and calculate with your business campaign and spend each penny accordingly.


